")
MACD RSI Bollinger Band Strategy (Complete 3-Indicator Trading System)
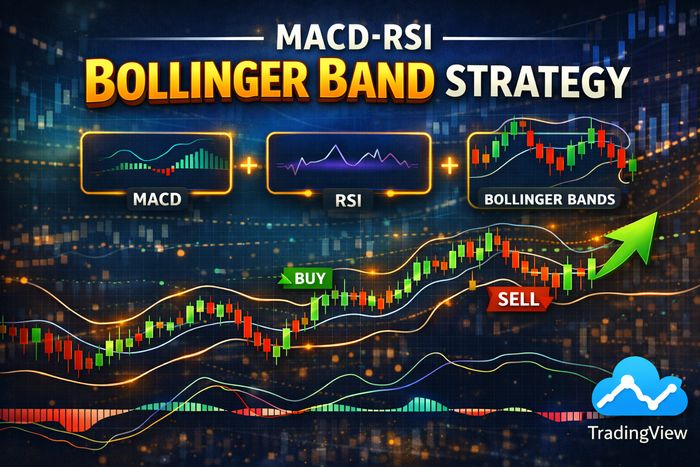
A combined MACD + RSI + Bollinger Bands strategy can be powerful because each tool answers a different trading question: Bollinger Bands show volatility and price location, RSI measures momentum and potential exhaustion, and MACD helps confirm trend direction and momentum shifts. Used together—correctly—these indicators can reduce false signals and create a clean, repeatable system for both day trading and swing trading.
The mistake many traders make is stacking indicators without rules. This guide fixes that by giving you a structured framework: best settings, clear entry/exit triggers, filters for trending vs ranging markets, and risk management that fits real-world execution. You’ll also learn why the “same signal” can be good in one environment and terrible in another—and how this 3-indicator system helps you spot the difference.
Educational content only. Trading involves risk.
Why Combine MACD, RSI, and Bollinger Bands?
The main advantage of combining indicators is confirmation without clutter. Many trading losses come from acting on a single signal that has no context. For example, price touching the upper Bollinger Band can mean “overextended” in a range—but it can mean “strong trend” in a band-walk. RSI might look overbought for a long time in a strong uptrend, and MACD can remain positive throughout.
When you build a ruleset where each indicator has a specific role, you get a system that answers:
- Where is price relative to volatility? (Bollinger Bands)
- Is momentum stretched or shifting? (RSI)
- Is trend momentum confirming the direction? (MACD)
Done correctly, this combination helps you avoid taking mean-reversion trades during strong trends, and it helps you avoid chasing breakouts when momentum is weak.

What Each Indicator Does in This Strategy (Clear Roles)
Bollinger Bands: volatility + location
Bollinger Bands create a dynamic envelope around price. For this system, bands do two things: (1) highlight volatility regime (tight bands = compression, wide bands = expansion), and (2) identify when price is extended (near outer bands) vs neutral (near the middle band).
RSI: momentum condition + divergence clues
RSI helps identify whether momentum supports continuation or suggests exhaustion. In this system, RSI is not used as a standalone “buy below 30, sell above 70” signal. Instead, it’s used as a filter: Is RSI aligned with the direction of the trade? Is RSI showing divergence near a band touch?
MACD: trend confirmation + momentum shift timing
MACD is useful for confirming trend direction and catching momentum shifts (like a pullback ending). In this system, MACD acts as a “green light” to trade with the dominant momentum rather than guessing reversals.
The result is a clean hierarchy: Bands define the environment, RSI checks momentum condition, and MACD confirms direction/timing.
Best Settings for a MACD RSI Bollinger Band Strategy
The settings below are widely used because they’re stable, readable, and easy to execute across markets. You can optimize later, but start here so you have a consistent baseline.
Recommended baseline settings (most traders)
- Bollinger Bands: 20-period, 2 standard deviations (20,2)
- RSI: 14-period (with 30/50/70 reference levels)
- MACD: 12, 26, 9 (standard)
Practical presets by style
| Trading style | Timeframe | Bands | RSI | MACD | Notes |
|---|---|---|---|---|---|
| Day trading (balanced) | 5m–15m | 20,2 | 14 | 12,26,9 | Clean and widely tested baseline |
| Scalping (faster) | 1m–3m | 10–14,2 | 7–14 | 12,26,9 | More noise; require stricter filters |
| Swing trading | 4H–1D | 20,2 (or 30,2) | 14 | 12,26,9 | Smoother bands reduce whipsaw |
Internal link idea (your site): If you have a dedicated guide, link it here: Bollinger Bands best settings.

Core Strategy Rules: The 3-Step Confirmation Model
This MACD RSI Bollinger Band strategy uses a simple sequence so you always know what to check first. Think of it as: Environment → Momentum Filter → Timing Trigger.
Step 1: Bollinger Bands define the environment
- Range environment: bands relatively flat; price oscillates between bands; middle band behaves like a magnet.
- Trend environment: bands slope; price “walks” an outer band; pullbacks often respect the middle band.
- Compression environment: bands narrow sharply (squeeze); volatility likely to expand soon.
Step 2: RSI filters bad trades
- Trend continuation longs: RSI often holds above ~50 and pulls back without collapsing.
- Trend continuation shorts: RSI often holds below ~50 and bounces without breaking higher.
- Mean reversion trades: RSI divergence near outer bands can improve edge (but don’t force it).
Step 3: MACD confirms direction and timing
- Continuation: MACD histogram re-accelerates after a pullback; MACD line holds its side of the signal line.
- Reversal attempts: MACD momentum weakens on a retest (helps confirm exhaustion).
Now let’s convert these ideas into three practical setups you can execute.
Setup A: Trend Continuation Entry (Highest-Probability Use Case)
The best way to use these three indicators together is often trend continuation—because it aligns with the market’s dominant force. You’re not trying to pick tops and bottoms. You’re joining momentum on favorable pullbacks.
Long entry rules (trend continuation)
- Bands: bands slope upward; price is generally holding above the middle band.
- Pullback: price pulls toward the middle band (or slightly below) without collapsing.
- RSI filter: RSI holds near/above 50 during pullback (or recovers quickly).
- MACD trigger: MACD histogram starts increasing again or MACD line crosses back above signal line.
- Entry: on continuation candle breaking the pullback micro-structure.
- Stop: below the pullback swing low (or a decisive close below the middle band).
- Target: partial at prior high; remainder toward upper band extension or 1.5–2R.
Short entry rules (trend continuation)
- Bands: bands slope downward; price holds below the middle band.
- Pullback: price retraces toward the middle band.
- RSI filter: RSI stays below ~50 or fails at 50.
- MACD trigger: histogram turns down again or MACD crosses below signal line.
- Entry: breakdown candle resumes trend direction.
- Stop: above pullback swing high.
- Target: partial at prior low; remainder toward lower band extension or 1.5–2R.
Why this works: Bollinger Bands tell you the trend and structure, RSI confirms momentum health, and MACD gives timing so you don’t enter too early.
Setup B: Mean Reversion Entry (Range Markets)
Mean reversion works when the market is rotating within a range. The middle band often behaves like a “return point.” This setup becomes dangerous when the market is trending strongly—so the environment step is critical.
Mean reversion long (lower band bounce)
- Bands: relatively flat; no consistent band walk.
- Trigger zone: price touches or slightly pierces the lower band.
- RSI filter: RSI is weak but begins to turn up (optional: bullish divergence).
- MACD timing: histogram starts rising (less negative) or a minor bullish cross appears.
- Entry: after a rejection candle forms.
- Target: middle band as primary exit.
- Stop: below the rejection swing low.
Mean reversion short (upper band fade)
- Bands: flat/neutral; price rotating.
- Trigger zone: price touches upper band and stalls.
- RSI filter: RSI turns down (optional: bearish divergence).
- MACD timing: histogram weakens or bearish cross appears.
- Entry: after rejection/engulfing candle.
- Target: middle band first.
- Stop: above the swing high.
The key: the strategy doesn’t say “touch band = reverse.” It says “touch band + RSI condition + MACD timing = trade.”
Setup C: Squeeze Breakout Entry (Volatility Expansion)
The squeeze breakout is a classic Bollinger Bands concept: when bands contract, volatility is compressed and a larger move often follows. RSI and MACD help you avoid weak breakouts and align with momentum.
Rules for squeeze breakout trades
- Bands: identify a clear squeeze (bands unusually narrow).
- Structure: mark the consolidation high/low.
- RSI filter: RSI begins pushing above 50 for bullish breakouts (below 50 for bearish).
- MACD trigger: histogram expands in breakout direction (momentum confirmation).
- Entry: breakout close or first retest of the breakout level.
- Stop: back inside the consolidation range.
- Target: 1–2R quickly or next key intraday level.
Squeeze breakouts are fast. If momentum doesn’t follow through quickly, treat it as a warning and protect the position.
Stops, Targets, and Risk Management (Make the Strategy Tradable)
Combining indicators doesn’t protect you from poor risk management. This section gives you rules that keep the strategy executable in real markets.
Stop-loss placement (by setup)
- Trend continuation: stop beyond pullback swing (or a decisive close beyond middle band).
- Mean reversion: stop beyond the rejection swing extreme.
- Breakout: stop back inside the squeeze range (range invalidation).
Targets (simple and effective)
- Middle band target: ideal for mean reversion trades.
- Prior high/low: natural intraday structure-based take profit.
- R-multiple: aim for 1.5–2R on continuation and breakouts, taking partials along the way.
Position sizing rules
Size your position based on stop distance. If your stop is wider, your size should be smaller. This keeps risk consistent and prevents one trade from destroying your week.
Daily guardrails (especially for day traders)
- Max daily loss: stop trading if hit.
- Max trades/day: prevents revenge trading.
- “A+ only” rule: if conditions are choppy, trade fewer signals with stronger confirmation.
Common Mistakes With MACD RSI Bollinger Band Strategies
Mistake 1: Using RSI overbought/oversold mechanically
RSI can stay “overbought” in strong uptrends and “oversold” in strong downtrends. Treat RSI as a filter and momentum clue, not a reversal button.
Mistake 2: Fading band touches during band walks
When price hugs an outer band and bands slope strongly, that’s often trend strength. Mean reversion trades become low probability. In those conditions, focus on pullback continuation setups instead.
Mistake 3: Taking signals without structure
Indicators work best when they align with market structure: range edges, swing highs/lows, breakout levels. If you can’t explain where the stop logically belongs, it’s usually not a good trade.
Mistake 4: Too many conflicting rules
A good system is easy to execute. Keep the role of each indicator clear and avoid extra indicators that create “analysis paralysis.”
Crypto Workflow and Execution Tips (MACD + RSI + Bollinger Bands)
Many crypto traders use TradingView for charting and then execute on an exchange. The key is consistency: use the same settings, the same timeframes, and the same entry checklist so you can evaluate performance cleanly.
Platforms many crypto traders consider
- BYBIT – often used for active trading workflows where fast execution and derivatives access matter.
- BITGET – commonly chosen for a straightforward interface and an active crypto trading ecosystem.
- MEXC – frequently used by traders looking for broad market selection and fast-moving opportunities.
Practical checklist before every trade
- Environment: Is it trend, range, or squeeze (Bollinger Bands)?
- Momentum condition: Is RSI aligned with the direction and behaving logically?
- Timing: Is MACD confirming the move or showing weakening momentum?
- Structure: Where is the stop? What’s the first target (middle band, level, or R-multiple)?
- Risk: Position size correct for stop distance?
Disclosure: This article may contain affiliate links. If you use them, we may earn a commission at no extra cost to you.

FAQ: MACD RSI Bollinger Band Strategy
Is MACD + RSI + Bollinger Bands a good strategy?
It can be, if each indicator has a clear role. Bollinger Bands define volatility and environment, RSI filters momentum conditions, and MACD confirms direction and timing. Without rules, stacking indicators can create confusion rather than edge.
What are the best settings for this strategy?
A strong baseline is Bollinger Bands 20,2, RSI 14, and MACD 12,26,9. Day traders often use these on 5m–15m charts; swing traders typically use them on 4H–Daily charts.
How do I avoid false signals?
Start with environment selection: don’t trade mean reversion during a band-walk trend. Use RSI as a filter (momentum alignment) and MACD as a timing tool, and only take signals that align with market structure (range edges, breakouts, swing levels).
Which setup is best for beginners?
Trend continuation (pullback entries) is often easier because it trades with the dominant direction. Use Bollinger Bands to confirm trend slope, RSI to check that momentum holds, and MACD to time the re-acceleration after pullbacks.
Can I use this strategy for crypto?
Yes. Crypto’s volatility makes Bollinger Bands especially useful for identifying squeezes and expansions. Just keep risk management strict, trade liquid pairs, and avoid over-leveraging until you have consistent results.


