+ Setups")
Last updated: February 2026.
Educational content only — not financial advice. Crypto is volatile. Indicators can help you organize risk, but they do not guarantee results.
Affiliate disclosure: This article includes promotional banners; if you use them, we may earn a commission at no extra cost to you.
Best Free TradingView Indicators for Crypto (2026): The Only Setups Most Traders Need
TradingView is full of indicators — built-ins, community scripts, and “secret sauce” overlays that promise perfect entries. The problem is that more indicators rarely means better trading. For crypto, the goal is usually simpler: identify the market regime (trend vs range), confirm momentum and volume, and manage risk without getting chopped to pieces.
This guide focuses on free TradingView indicators for crypto that are widely available, easy to validate, and practical for both traders and investors. You’ll get two comparison tables, a clear methodology, three ready-to-use templates (with “budget” and risk rules), a hidden-costs breakdown, and a troubleshooting section that solves the common reasons indicator strategies fail.
Quick Answer / Key Takeaways
- Start with a 3-layer stack: Trend filter (EMA/VWAP), Momentum (RSI/MFI/MACD), Volatility/Risk (ATR/Bollinger).
- Crypto-friendly “default” picks: 200 EMA + VWAP, RSI (14), MFI (14), Bollinger Bands (20, 2), ATR (14), Volume Profile (Visible Range).
- One indicator per job: Don’t use three momentum indicators. Pick one and learn it deeply.
- Prevent overtrading: Most “indicator losses” are actually fee/spread losses caused by too many low-quality signals.
- Rules beat settings: A simple checklist + risk rules matters more than “perfect parameters.”
Table of Contents
- 1) What Makes a “Best” Free Indicator for Crypto?
- 2) At-a-Glance Comparison / Scorecard (Table)
- 3) Best-for Use Cases (Table)
- 4) Methodology: How We Evaluate Indicators
- 5) The Foundation Stack (Trend + Momentum + Risk)
- 6) Best Free Trend Indicators
- 7) Best Free Momentum Indicators
- 8) Best Free Volatility / Range Indicators
- 9) Best Free Volume / Flow Indicators
- 10) 3 Ready-to-Use Trading Templates (Budgets + Rules)
- 11) Hidden Costs: Fees, Spread, Conversions, and “Signal Tax”
- 12) Execution Matters: Turning Signals Into Trades
- 13) Common Problems & Fixes (Minimum 6)
- FAQ + Schema
1) What Makes a “Best” Free Indicator for Crypto?
Crypto has unique market behavior: frequent volatility spikes, weekend liquidity shifts, aggressive mean reversion after liquidation cascades, and long periods where one headline can invalidate a clean setup. That’s why the “best free TradingView indicators for crypto” share three qualities:
1.1 They are regime-aware (trend vs range)
Many indicators “work” in one regime and fail in the other. For example, RSI overbought signals can be devastating in a strong uptrend — price can stay overbought for a long time. So the best indicators are either regime-aware, or you pair them with a regime filter (like a long EMA or VWAP).
1.2 They are easy to validate and difficult to “fake”
The easiest way to fool yourself is to use complex indicators that look perfect in hindsight. Free does not mean bad — but you should prefer indicators that are simple enough to understand, explain, and test without magical thinking.
1.3 They improve decision quality, not just signal quantity
More signals usually increases fees and emotional errors. The best indicators reduce decisions: “trend is up, momentum is supportive, volatility is acceptable, risk is defined.”
If you want an additional overview page, see our internal hub: TradingView free indicators for crypto (2026 guide & setups).
2) At-a-Glance Comparison / Scorecard (Table)
This table compares widely used free TradingView indicators (built-in or commonly available) and shows when they tend to help crypto traders the most. Scores (1–5) are practical “usefulness” scores, not profitability guarantees.
| Indicator | Type | Best Market Regime | Crypto Use | Typical Starting Settings | Common Mistake | Usefulness (1–5) |
|---|---|---|---|---|---|---|
| 200 EMA | Trend filter | Trend | Defines macro bias; avoids counter-trend trades | EMA 200 (daily/4H) | Using it as a precise entry trigger | 5 |
| VWAP | Mean / fair value | Trend + range | Great for intraday “fair price” and reversion | Session VWAP | Ignoring session boundaries | 5 |
| RSI | Momentum | Range + trend (with filter) | Spot momentum shifts; divergence (carefully) | 14; levels 40/60 in trends | Treating 70/30 as universal | 4 |
| MACD | Momentum / trend | Trend | Momentum confirmation; trend continuation signals | 12/26/9 | Overreacting to every cross in chop | 4 |
| Bollinger Bands | Volatility bands | Range + breakouts | Compression → expansion; mean reversion | 20 SMA, 2 stdev | Shorting every upper-band touch in uptrends | 5 |
| ATR | Volatility / risk | All | Stop sizing; position sizing; trailing logic | 14 | Using ATR as direction signal | 5 |
| MFI | Volume-weighted momentum | Range + transitions | Momentum with volume context | 14 | Ignoring liquidity differences across pairs | 4 |
| Volume Profile (Visible Range) | Market structure | All | POC/value area; high-liquidity zones | Visible Range / Session | Forcing levels on low-liquidity charts | 5 |
| ADX / DMI | Trend strength | Trend vs chop filter | Filters “no-trade” chop periods | 14 | Using ADX directionally | 4 |
| Ichimoku Cloud | Trend system | Trend | Multi-component trend/levels system | Default | Using it without understanding components | 3 |
| Stochastic RSI | Fast momentum | Range | Short-term turning points | 14/14/3/3 | Overtrading every wiggle | 3 |
| Donchian Channels | Breakout | Trend + breakouts | Simple breakout framework; trend continuation | 20 | Chasing breakouts without risk rules | 4 |
3) Best-for Use Cases (Table)
This table answers the question traders actually ask: “Which indicator set should I use for my style?” The best approach is usually a stack — one indicator per job.
| Use Case | Market Regime | Best Free Indicator Stack | Entry Logic (Simple) | Risk Logic (Simple) |
|---|---|---|---|---|
| Trend-following swing trades (4H/D) | Trend | 200 EMA + MACD + ATR | Only longs above 200 EMA; MACD supports | Stop = 1.5–2.5 ATR; trail after structure break |
| Range trading (1H/4H) | Range | Bollinger Bands + RSI + Volume Profile | Buy value-area lows + RSI recovery; sell near value-area highs | Stop beyond band + structure; reduce size in high ATR |
| Intraday mean reversion (5m–30m) | Mixed | VWAP + RSI/MFI + ATR | Fade extremes back to VWAP with momentum confirmation | Stop = ATR-based; take partial at VWAP |
| Breakout trading (15m–4H) | Expansion after compression | Donchian + Bollinger “squeeze” + Volume | Trade breakouts only after compression + volume expansion | Stop below breakout level; invalidation-based exit |
| Long-term investing (D/W) | Macro cycles | 200 EMA + Volume Profile + ATR | Add when bias is bullish and pullbacks hold value area | Position sizing + drawdown rules; avoid leverage |
4) Methodology: How We Evaluate Indicators
To decide whether an indicator deserves a spot in a “best free TradingView indicators for crypto” list, we use these criteria:
- Role clarity: does it clearly measure trend, momentum, volatility, or structure?
- Regime compatibility: do you know when to ignore it (trend vs range)?
- Parameter robustness: does it still work if you shift settings slightly (avoid fragile tuning)?
- Decision impact: does it reduce bad trades or just create more signals?
- Risk integration: can it support stop sizing, invalidation, or position sizing?
- Ease of verification: can you test it with simple chart replay / manual backtesting?
- Low “repaint risk”: avoid indicators that change past signals after new candles close.

5) The Foundation Stack (Trend + Momentum + Risk)
If you want the shortest path to competence, build a foundation stack that works across many coins and timeframes. A reliable “base” is:
- Trend filter: 200 EMA (macro) or 50/200 EMA combo (medium-term)
- Momentum confirmation: RSI or MACD (choose one at first)
- Risk/volatility: ATR for stop sizing and position sizing
- Optional structure layer: Volume Profile (Visible Range) for value zones
5.1 Why this beats “10-indicator” charts
Most losing indicator strategies fail because they:
- Use multiple indicators that measure the same thing (three momentum tools)
- Take signals in the wrong regime (range rules in a trend)
- Ignore risk sizing (no ATR-based logic)
- Overtrade (fees and spreads quietly eat expectancy)
5.2 A simple rule that improves almost every indicator strategy
Only trade indicator signals in the direction of your trend filter (or demand stronger confirmation for counter-trend trades). This single rule reduces the “death by a thousand signals” problem.
6) Best Free Trend Indicators
6.1 Exponential Moving Averages (EMA): 50 and 200
EMAs are simple and powerful because they enforce discipline: trade with the dominant direction or demand strong evidence before fading it. For crypto, a common approach is:
- 200 EMA as macro bias (especially on 4H/D)
- 50 EMA as medium-term trend and pullback guide
Crypto tip: EMAs are lagging. Don’t expect them to call tops or bottoms. Use them to avoid fighting the big move.
6.2 VWAP (Volume Weighted Average Price)
VWAP is a “fair price” anchor many traders use intraday. It’s especially useful for:
- Mean reversion entries back toward VWAP after a spike
- Trend continuation: price holds above VWAP in uptrends
- Filtering chop: repeated VWAP cross-and-recross can signal no-trade conditions
Best practice: treat VWAP as a framework, not an automatic signal. Combine with momentum or structure.
6.3 ADX / DMI (Trend Strength Filter)
ADX helps you answer: “Is the market trending enough for trend strategies?” In crypto, this matters because chop can create endless false breaks and MACD/RSI whipsaws. Use ADX as a filter:
- When ADX suggests low trend strength, reduce size or prefer range logic
- When ADX suggests stronger trend strength, prioritize trend-following entries
7) Best Free Momentum Indicators
7.1 RSI (Relative Strength Index): use crypto-friendly levels
RSI is often misused. In strong uptrends, RSI can stay high for extended periods, so “RSI > 70 = sell” becomes a trap. A more crypto-friendly approach is to change levels based on regime:
- In uptrends: consider RSI support zones like 40–50 instead of waiting for 30
- In downtrends: consider RSI resistance zones like 50–60 instead of buying 70/30 reversals
7.2 MACD: momentum confirmation, not a magic cross
MACD shines as a confirmation tool in trends. The mistake is taking every cross in a sideways range. MACD becomes far more useful when paired with:
- A trend filter (e.g., 200 EMA)
- A structure zone (e.g., Volume Profile value area)
- A volatility check (ATR is not spiking)
7.3 MFI (Money Flow Index): momentum with volume context
MFI is similar to RSI but incorporates volume, which can improve signal quality when liquidity is consistent. It’s often used to spot:
- Momentum shifts that are “backed by flow” rather than pure price drift
- Potential exhaustion when combined with structure and volatility
For a step-by-step setup, see: MFI indicator on TradingView (setup, settings, signals).
8) Best Free Volatility / Range Indicators
8.1 Bollinger Bands: the most versatile free volatility tool
Bollinger Bands can support two very different strategies:
- Mean reversion: fade extremes back toward the middle band in a stable range
- Breakout logic: compression (“squeeze”) → expansion (momentum breakout)
The crypto mistake is applying mean reversion rules in a strong trend. If price is trending and riding the upper band, repeatedly shorting “because it touched the band” can be expensive.
If you need the exact TradingView clicks and best starting settings, read: how to add Bollinger Bands in TradingView (step-by-step).
8.2 ATR: the risk engine (not a signal generator)
ATR becomes powerful when you use it to define:
- Stop distance: avoid setting stops inside normal noise
- Position size: smaller size when volatility is higher
- Trailing logic: trail stops based on volatility rather than emotion
Practical starter rule: stop distance = 1.5–2.5 × ATR (depends on timeframe and strategy). Then size the trade so your max loss per trade is consistent.
8.3 Donchian Channels: simple breakout framework
Donchian Channels are a clean way to trade breakouts without complex logic. They work best when you:
- Trade only in the direction of your trend filter
- Require confirmation (volume expansion or momentum support)
- Define invalidation clearly (breakout level fails)
9) Best Free Volume / Flow Indicators
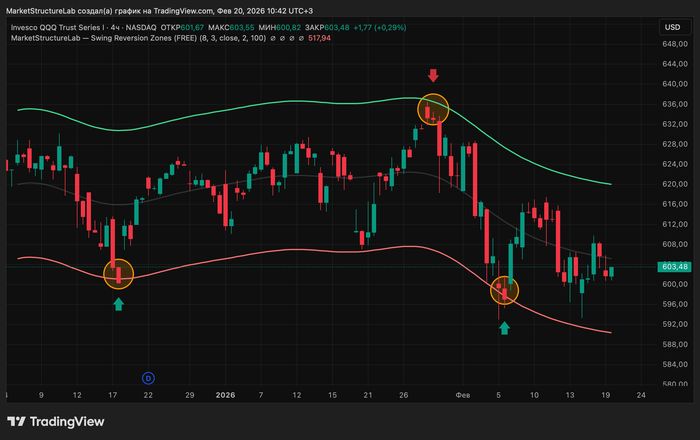
9.1 Volume Profile (Visible Range): structure and “where trading happens”
Volume Profile helps you see high-activity zones where participants historically agree on value. In crypto, this matters because price often reacts around:
- Point of Control (POC): the highest volume price zone
- Value area high/low: edges where price may reject or break through
Pro tip: Use Volume Profile to define zones, then use your momentum/volatility tools to time entries.
9.2 OBV (On-Balance Volume): simple accumulation/distribution lens
OBV can be useful when price is stuck but volume suggests accumulation. It’s not perfect, but it’s free, simple, and can support “is this move real?” thinking — especially when paired with a trend filter.
9.3 MFI again (because it straddles volume + momentum)
If you want exactly one “flow-aware” momentum tool, MFI is a reasonable pick. Just remember: volume signals can distort on illiquid pairs, so prefer higher-liquidity markets when using volume-based logic.

10) 3 Ready-to-Use Trading Templates (Budgets + Rules)
These templates are designed to be copyable. “Budget” here means your trading account size and the risk rules that keep you alive long enough to learn. If you already have a strict risk policy, keep it — and adapt only the indicator stack and entry logic.
Template A: Micro Account Trend Swing (Budget: $250–$2,000)
- Goal: learn trend discipline; avoid overtrading.
- Timeframe: 4H entries, Daily bias check.
- Indicators: 200 EMA (bias), MACD (momentum confirmation), ATR (risk).
- Entry rule: Only take longs when price is above 200 EMA and MACD supports momentum; wait for pullback + structure hold.
- Risk rule: risk per trade = 0.5%–1% of account.
- Stop rule: stop distance = 2 × ATR (then size accordingly).
- Exit rule: take partial at 1R; trail remaining behind structure or an ATR trail.
- Anti-overtrade rule: maximum 3 trades/week until consistency improves.
Template B: Range + Mean Reversion (Budget: $2,000–$15,000)
- Goal: exploit range behavior and volatility compression/expansion.
- Timeframe: 1H or 4H (avoid ultra-noisy lower timeframes at first).
- Indicators: Bollinger Bands (20,2), RSI (14), Volume Profile (Visible Range), ATR (risk).
- Entry rule (range): buy near value-area low when RSI recovers from weak momentum and price rejects lower band; sell/trim near value-area high or upper band.
- Risk rule: risk per trade = 0.5%–1% of account; reduce size if ATR spikes.
- Stop rule: stop beyond the band + beyond local structure (avoid “band-only” stops).
- Exit rule: first target = VWAP or middle band; second target = opposite value edge.
- Regime rule: if price starts trending and walking the band, stop fading it and switch to trend logic.
Template C: Active Trader Hybrid (Budget: $15,000–$250,000+)
- Goal: combine structure zones with momentum confirmation; avoid chop.
- Timeframe: 15m–1H entries, 4H context.
- Indicators: VWAP, 50 EMA, MFI (14) or RSI (choose one), ATR (risk), Volume Profile (Visible Range).
- Entry rule (trend day): trade pullbacks to VWAP/50 EMA in the direction of 4H bias; require momentum confirmation (MFI/RSI turns up for longs).
- Entry rule (range day): use value area edges + momentum shifts; prioritize mean reversion back to VWAP.
- Risk rule: risk per trade = 0.25%–0.75% (smaller % for higher frequency).
- Stop rule: ATR-based + invalidation (structure break). If invalidated, exit — don’t “indicator hope.”
- Quality filter: if VWAP is repeatedly crossed and ADX suggests weak trend, reduce trades (chop zone).
10.4 User snapshots (positive/neutral themes from public reviews)
The four callouts below paraphrase positive/neutral user sentiments found on public review pages. They are not guarantees of performance, and public reviews can be biased.
User snapshot:
A long-time trader praised TradingView’s alert system and cross-device workflow, describing alerts as reliable and highly configurable for active monitoring.
User snapshot:
A reviewer described the app as excellent for analysis, easy to use, and “packed with indicators,” highlighting that the charting toolkit feels complete even without paying.
User snapshot (neutral):
One user called it a solid app with great charting tools, while noting occasional quirks like indicator layouts not saving perfectly or notifications arriving late on mobile.
User snapshot (neutral-positive):
A paid user said they love the platform overall, but still wanted a couple of additional data/chart conveniences—suggesting strong satisfaction with room for minor improvements.
11) Hidden Costs: Fees, Spread, Conversions, and “Signal Tax”
Indicators feel free, but trading the signals is not. The biggest “hidden cost” of indicator-based crypto trading is what you might call signal tax: costs that accumulate when you act on too many low-quality signals.
11.1 A simple all-in cost formula (use this before you add indicators)
All-in Trading Cost ≈ (Entry fee + Exit fee) + (Spread/price impact) + (Slippage) + (Funding, if perps) + (Conversion costs)
The more your indicators push you to trade, the more this compound cost matters — especially in sideways markets.
11.2 Worked example (illustrative)
Scenario: You trade a “busy” indicator stack that produces 30 round trips per month on a mid-liquidity alt pair.
- Average spread/price impact per trade (illustrative): 0.12%
- Entry+exit fees combined (illustrative): 0.10%
- Average slippage (illustrative): 0.05%
Estimated cost per round trip ≈ 0.12% + 0.10% + 0.05% = 0.27%
If average position value is $2,000:
$2,000 × 0.27% ≈ $5.40 per round trip
30 round trips × $5.40 ≈ $162/month in “signal tax” before you even consider wins/losses.
Takeaway: A cleaner, lower-frequency indicator strategy can outperform simply by avoiding cost drag.
11.3 How to reduce hidden costs without “going slower”
- Use a trend filter: it cuts low-quality counter-trend signals.
- Require confluence: structure zone + momentum confirmation + volatility acceptable.
- Limit trades: cap daily/weekly trades to prevent churn.
- Avoid unnecessary conversions: don’t bounce between assets just because an indicator flipped.

12) Execution Matters: Turning Signals Into Trades
Indicators do not trade — you do. And execution quality can be the difference between “the setup worked” and “my fill was terrible.” If you’re using TradingView indicators for crypto, build an execution checklist:
12.1 The execution checklist
- Liquidity check: prefer higher-liquidity pairs for indicator strategies.
- Order type: avoid market orders in thin books; use limit orders when appropriate.
- Plan the exit: define stop and take-profit before entry.
- Don’t chase: if price moved too far from your planned level, skip it.
- Keep the chart clean: your indicator stack should reduce decisions, not add them.
12.2 If you want faster “signal-to-trade” routines
Many traders keep an exchange account ready with pre-defined watchlists and risk rules so they can act on alerts quickly. Popular venues people compare for active crypto trading include Bybit, Bitget, and MEXC (use the banners above if you want to explore promotions). Regardless of platform, the key is to reduce friction: stable security settings, consistent position sizing, and fewer impulsive clicks.
13) Common Problems & Fixes (Minimum 6)
If you’ve ever said “indicators don’t work,” there’s a good chance one of these issues is the real cause.
Problem 1: Too many indicators doing the same job
Fix: Use one trend tool, one momentum tool, one risk tool. If you add a fourth, it should be structure (Volume Profile) — not another oscillator.
Problem 2: You trade RSI/Bollinger the same way in trends and ranges
Fix: Add a trend filter (200 EMA). In trends, treat “overbought” differently and focus on pullbacks; in ranges, mean reversion works better.
Problem 3: You keep changing settings until it looks perfect
Fix: Choose robust baseline settings (defaults are fine), then adjust only if you have a written reason and you test across multiple market periods.
Problem 4: Your indicator strategy overtrades and fees eat you alive
Fix: Introduce a trade cap (e.g., max 1–2 trades/day), require confluence, and avoid low-liquidity pairs. Track your “signal tax” monthly.
Problem 5: Timeframe mismatch (indicator signals vs your holding period)
Fix: Match timeframe to intent. Don’t use a 5m oscillator for a multi-day thesis unless you’re only timing the entry and you accept noise.
Problem 6: You ignore volatility spikes (ATR) and get stopped out by noise
Fix: Use ATR-based stops and position sizing. When ATR is high, either trade smaller or wait for conditions to normalize.
Problem 7: You rely on divergence as a primary entry trigger
Fix: Use divergence as a “heads up,” then require structure + confirmation. Divergence can persist and fail repeatedly in strong trends.
Problem 8: You don’t document rules, so you trade feelings
Fix: Write a one-page playbook: entry checklist, risk rules, exit rules, and “no-trade” conditions. Then follow it for 20–50 trades before judging.
FAQ
1) What are the best free TradingView indicators for crypto?
For most traders, a practical free stack is 200 EMA (trend filter), RSI or MACD (momentum), Bollinger Bands (volatility), and ATR (risk). Add Volume Profile for structure if you want zones.
2) How many indicators should I use on one chart?
Usually 3–4 max. One per job (trend, momentum, risk, optional structure). More indicators often increases confusion and overtrading.
3) Are free indicators “good enough” for crypto?
Yes — many built-in tools are excellent. The edge typically comes from rules and risk management, not expensive indicators.
4) Which indicator is best for spotting trends in crypto?
Simple moving averages (like the 200 EMA) are among the most reliable trend filters. Combine with MACD or structure zones to avoid chop.
5) Which indicator is best for ranges and mean reversion?
Bollinger Bands plus RSI (or MFI) can work well in ranges, especially when you confirm with structure (value area edges) and keep ATR-based risk controls.
6) Why do indicator strategies fail in crypto?
Common reasons include trading the wrong market regime, overfitting settings, overtrading in low liquidity, ignoring volatility (ATR), and failing to define invalidation.
7) Can TradingView indicators predict tops and bottoms?
Not consistently. Indicators are best used for bias, confirmation, and risk framing — not perfect prediction.
8) What’s the fastest way to improve my indicator results?
Reduce trades, add a trend filter, require confluence, and enforce ATR-based position sizing. Then track your all-in costs and your rule adherence.